
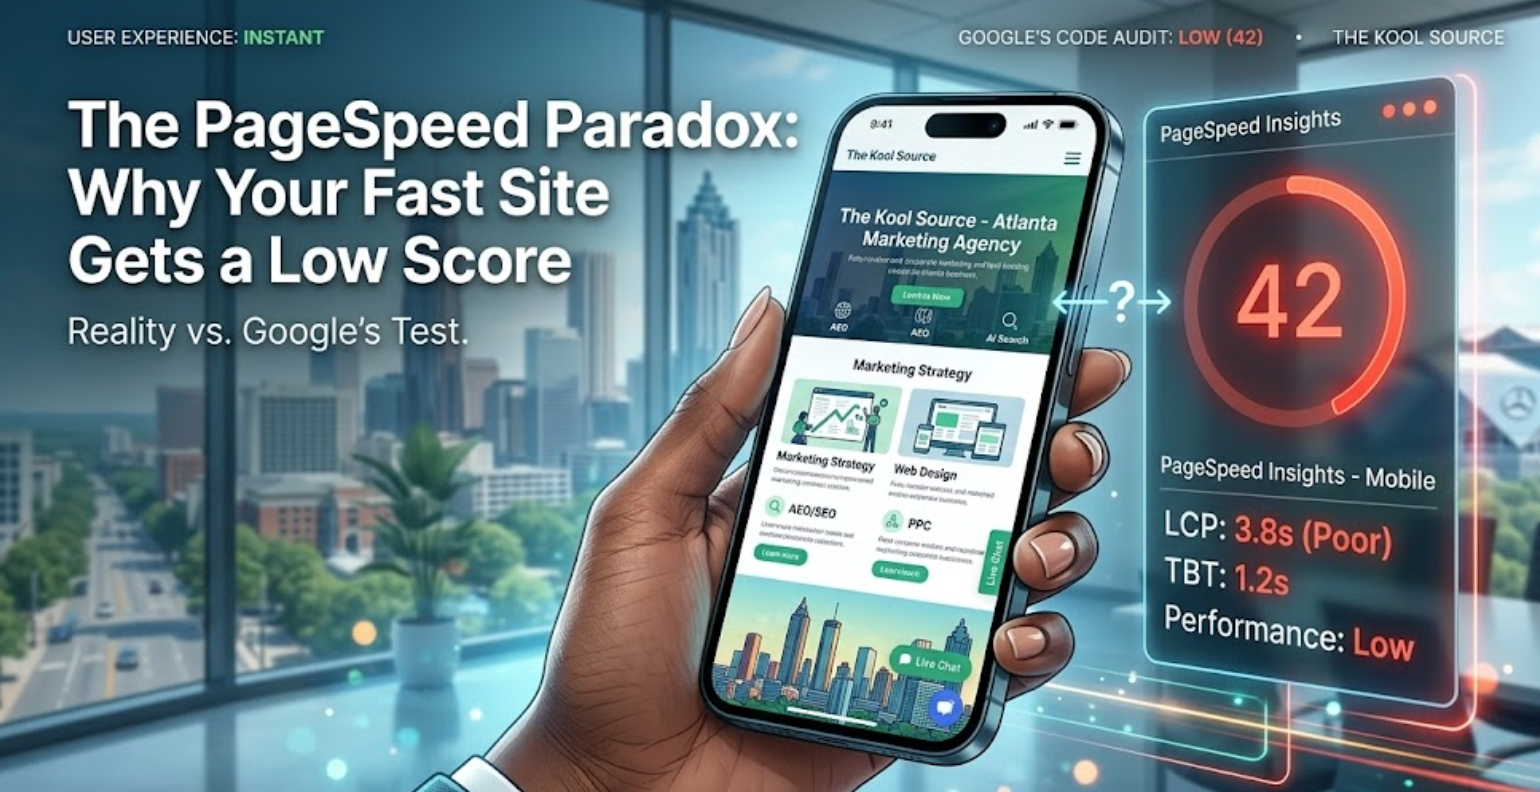
You pull up your business website on your phone or laptop. It pops up right away. The images look crisp, the buttons work, and the user experience feels smooth.
Just to be safe, you drop your URL into Google’s free PageSpeed Insights tool to check the technical performance. A few seconds later, the results flash on the screen in bright orange or red: 42 out of 100.
It’s an alarming number to look at. It is easy to worry instantly that something is wrong with the development, that the hosting is lagging, or that search engines will hide the website from potential clients.
But if the website literally opens in a blink of an eye when you use it, why is the tool scoring it so low?
This is the PageSpeed Paradox. There is a massive disconnect between real-world user experience and automated test scores. Here is the technical reality of why these two metrics don’t match up, and what actually matters for the bottom line.
1. Google Tests the “Worst-Case Scenario”
When you visit your own website, your browser uses a shortcut. Because you’ve been there before, your device has likely “cached” (saved) the site’s logo, fonts, and structural files. On top of that, you are probably testing it on a fast office Wi-Fi connection or a strong 5G signal.
Google’s testing tool purposely ignores those ideal conditions.
When PageSpeed Insights runs an audit, it simulates a first-time visitor using a mobile connection with a throttled processor.
It evaluates the website under harsh, restrictive conditions to see how the code performs when a user has a weak cellular signal on an older device. The tool shows how the site loads for a stranger on the move, not for you at your desk.
2. The Tool Flags Elements That Actually Generate Revenue
This is a critical nuance of web performance: Google PageSpeed Insights is a laboratory code test, not a business test.
The grading algorithm naturally rewards empty, basic websites because there is no data to process. But an active business website needs tools to engage visitors and track marketing performance. Ironically, the exact features required to run a modern digital strategy are the ones that lower the lab score:
- Live Chat Widgets: Excellent for immediate customer service, but they add script weight that lowers the score.
- Tracking Pixels (Meta, Google Analytics): Essential for measuring ad ROI and traffic attribution, but flagged as “third-party delays.”
- High-Quality Videos: Crucial for demonstrating a product or service, but demanding for a simulated mobile processor to render.
- Interactive Forms: Vital for capturing email leads and inquiries, but they can trigger layout shift warnings.
Stripping away every piece of code the tool complains about would result in a plain-text document. The site would get a high grade, but it would lose the ability to interact with customers.
3. Laboratory Scores vs. Real-World Data (Field Data)
Before your actual Performance Score, you’ll find a section on PageSpeed Insights called “Core Web Vitals.” This is the data that carries actual weight.
Google divides performance measurements into two distinct categories:
The Top Section: “Discover what your real users are experiencing” (Field Data)
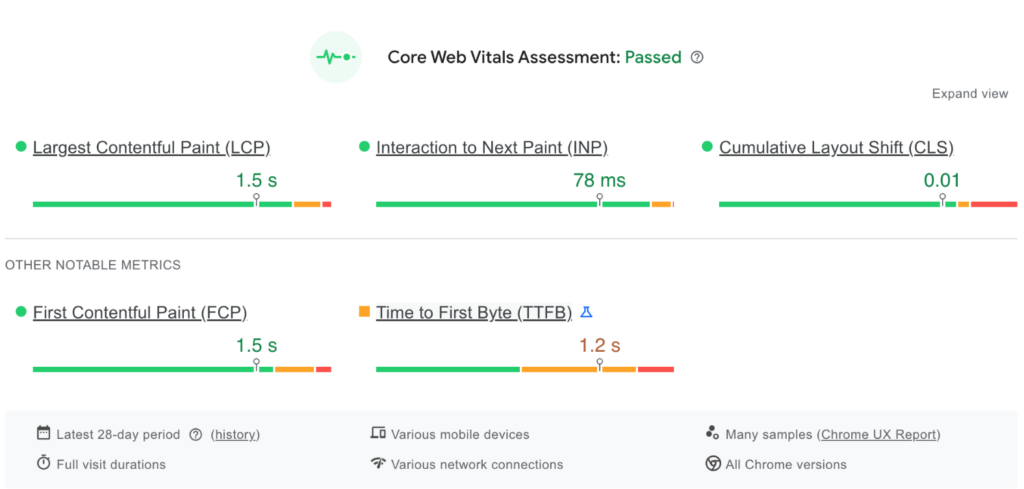
This is the Field Data. It pulls real performance data that reflects actual human visits over a rolling 28-day window.
- What it tracks: It displays the actual pass/fail metrics for Core Web Vitals, covering how fast your page loads and how much the screen shifts as it loads.
- The Catch: If a website doesn’t get enough monthly traffic, Google won’t have enough real-world data to generate this section. Instead, it will display a message saying “Insufficient real-world data” and default purely to the simulated score.
The Bottom Section: “Diagnose performance issues” (Lab Data)
If you scroll down past the real-user data, you reach the Lab Data (powered by Lighthouse). This is where that single, heavily debated grade out of 100 sits. It is entirely a simulation run in a closed environment on a throttled connection.
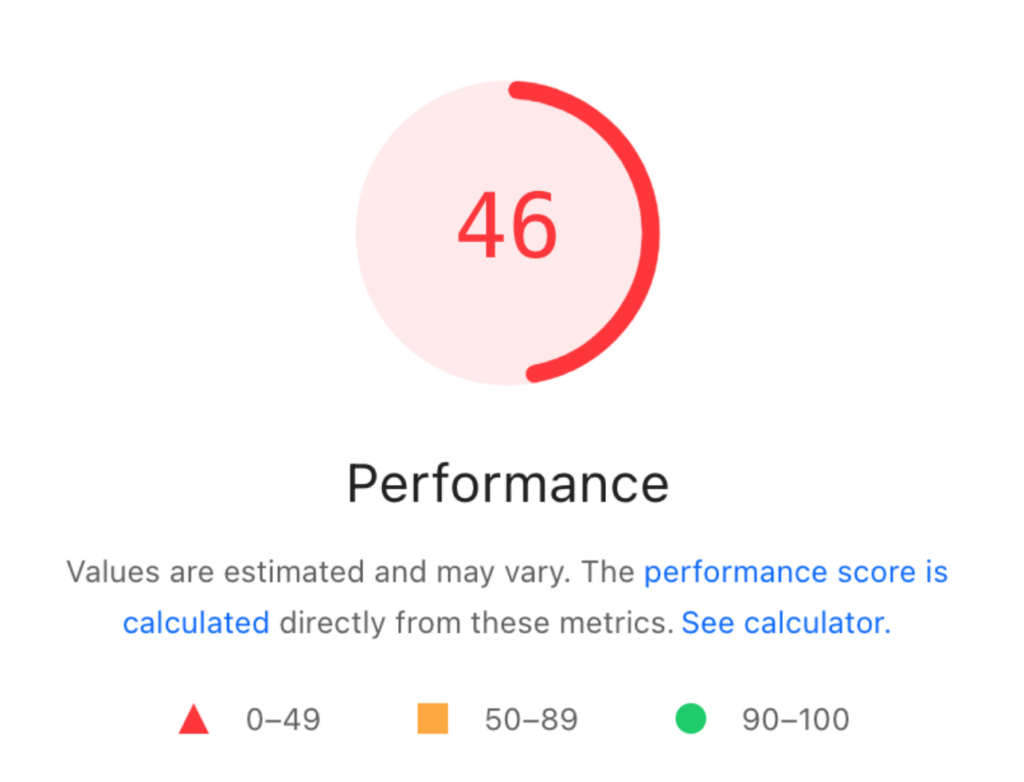
If the real-world “Field Data” shows that actual visitors successfully load and interact with the site in under 3 seconds, the website is performing exactly as it should.
Search engines look at actual user experience, meaning a site won’t be penalized just because a simulated lab test flags a necessary marketing pixel.
Focus on the User, Not the Number
A website’s ultimate objective is to convert a visitor into a lead or a sale. Speed is a massive part of that equation. If a site takes 5 seconds to load for a real user, it absolutely needs to be optimized because you certainly wouldn’t wait that long when you’re searching.
However, chasing a perfect 100/100 score just to get a green circle often results in diminishing returns.
An effective digital strategy requires a balance between speed and utility. The goal should be optimizing images, compressing code, and streamlining server response times so that the site feels lightning-fast to real people, while keeping the essential marketing and communication tools fully intact.
SEO & PPC Digital Marketing Agency in Atlanta
At The Kool Source, we offer specialized marketing services right here in Atlanta to bridge the gap between technical metrics and real business results.
From custom web design and logo design that builds instant trust, to advanced AEO/SEO and targeted PPC campaigns that capture high-intent traffic, we ensure your entire digital presence is optimized to convert.

- Why Your Website Is Burning Your Google Ads Budget (And How to Fix It) - September 23, 2026
- 9 Marketing Fundamentals Every Business Should Know Before Using AI Tools - September 3, 2026
- Why Have My Website Clicks Dropped? Zero-Click Search & Small Business - July 31, 2026
0 Comments